Ten New Graphical Dashboard Widgets

Ten New Graphical Dashboard Widgets

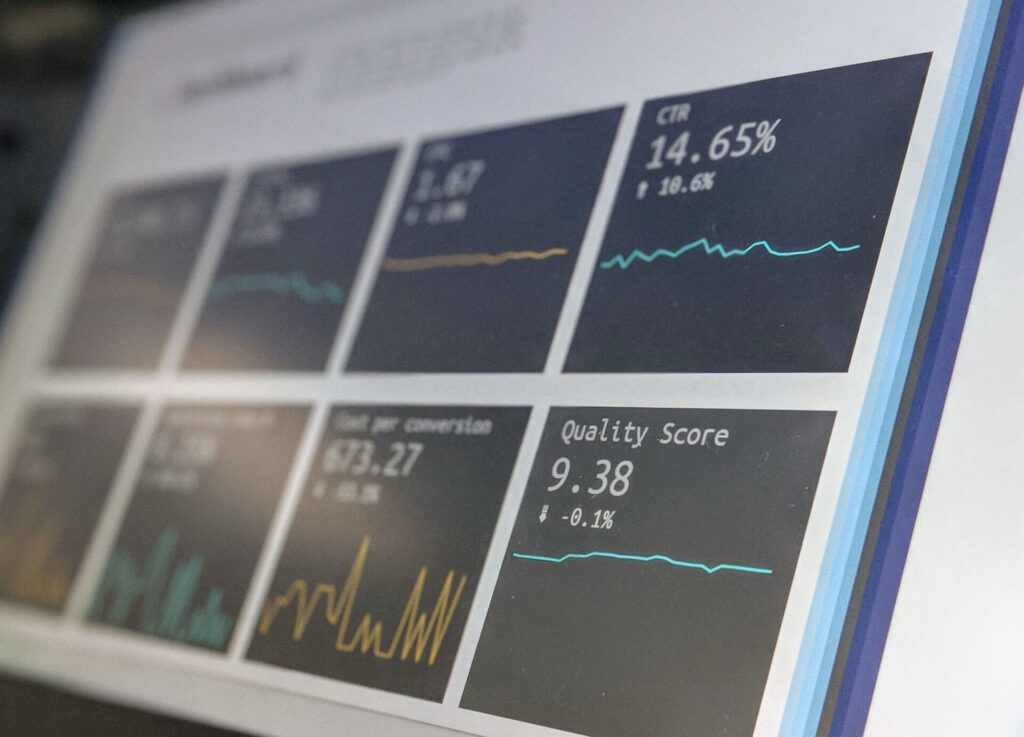
We recently added another new set of dashboard widgets to help tour and activity operators learn about how their operation is performing and be able to make decisions. This collection of ten new widgets are the first widgets available that utilize pie and bar charts to graphically display data.

You can now see graphs regarding orders and revenue by product type, by country, and by language. These are just the start of an even more advanced and powerful dashboard experience.

a person holding a flower
News
Virginia

Virginia Introduction

Traveling and experiencing new places has always been a passion for Virginia. Born in New York City and raised in Alabama, her love of travel

Read More »
a close up of a tree
Blog
Virginia

Holiday Promotions and Giveaways

Holiday season is almost here! Not only do holidays spread joy and bring family and friends together, but they can also be an excellent time to increase your website traffic.

Read More »
a man using a laptop computer sitting on top of a table
Feature Announcements
TRYTN

Custom Invoice Emails

We recently enhanced our invoicing capabilities in a big way. Each tour operator has specific business needs and so a one-size-fits-all invoice email just didn’t

Read More »

Request a Demonstration