Ten New Graphical Dashboard Widgets

Ten New Graphical Dashboard Widgets

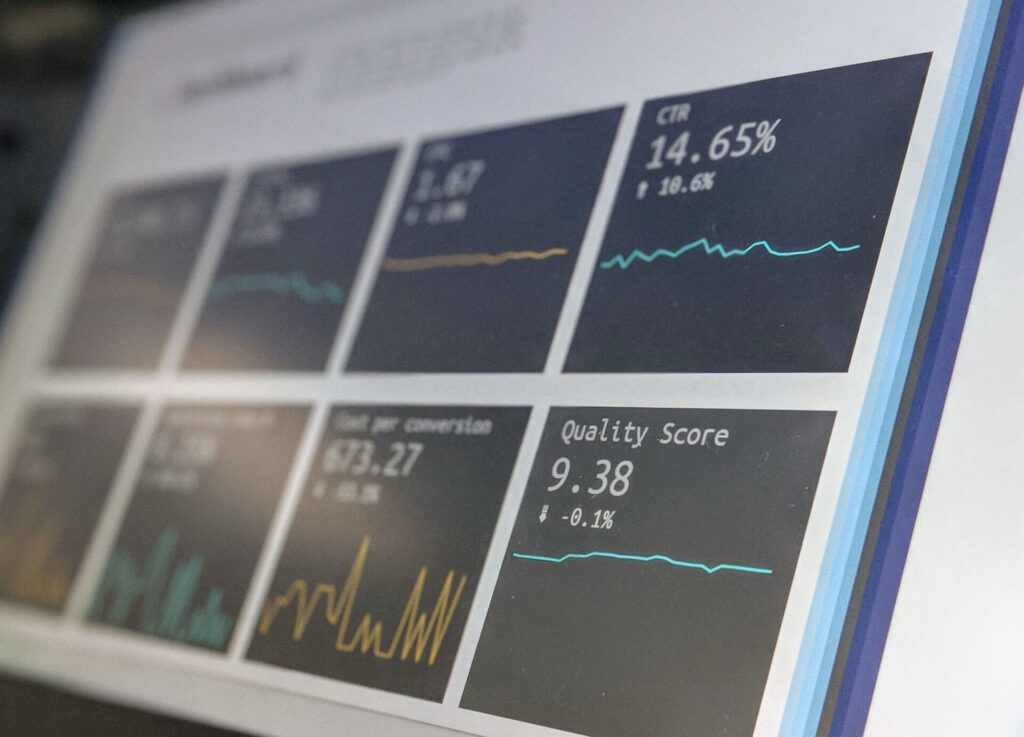
We recently added another new set of dashboard widgets to help tour and activity operators learn about how their operation is performing and be able to make decisions. This collection of ten new widgets are the first widgets available that utilize pie and bar charts to graphically display data.

You can now see graphs regarding orders and revenue by product type, by country, and by language. These are just the start of an even more advanced and powerful dashboard experience.
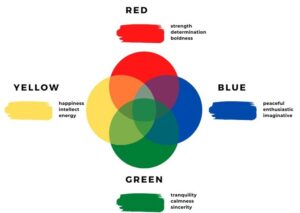
diagram
Blog
Virginia

Reimagining Company Logos

A company’s logo is important, whether you’re starting a business or refreshing your look. Having a timeless logo allows you to capture your customers’ attention and become memorable.

Read More »
Blog
Virginia

Responding to Reviews

Could making your company shine be as easy as responding to customer reviews? In this article you will learn why simply replying to customers’ reviews is so important in making each customer feel valued, appreciated and ultimately validated.

Read More »
a person standing on top of a mountain
Blog
Virginia

The Rise of Solo Travel

Over the past few years, solo trips have become a growing trend in the tourism industry. With more and more people deciding to travel alone, one factor has endured — tourists want to have fun!

Read More »

Request a Demonstration