Ten New Graphical Dashboard Widgets

Ten New Graphical Dashboard Widgets

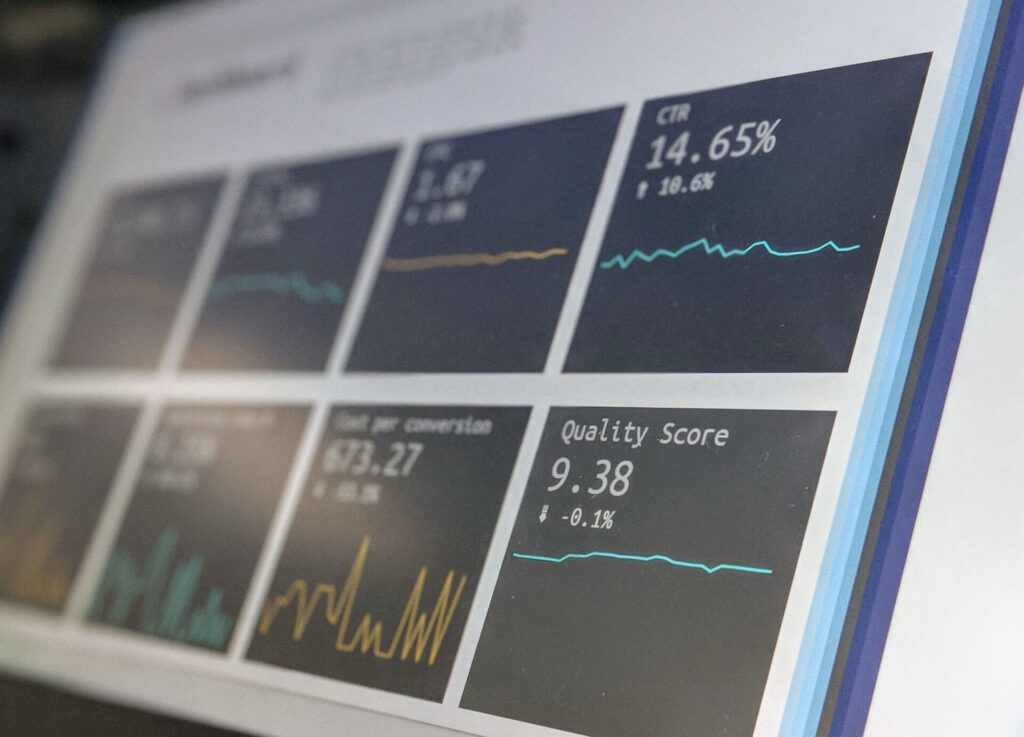
We recently added another new set of dashboard widgets to help tour and activity operators learn about how their operation is performing and be able to make decisions. This collection of ten new widgets are the first widgets available that utilize pie and bar charts to graphically display data.

You can now see graphs regarding orders and revenue by product type, by country, and by language. These are just the start of an even more advanced and powerful dashboard experience.

Feature Announcements
TRYTN

Customer Cart Widget

We recently released some new functionality specific for those tour operators that use the embedded booking experience. We’ve heard feedback that customers find it confusing

Read More »
someone ideating on a white board with comps
Release Notes
TRYTN

May 2021 Release Notes

Is it already the end of May?! We’ve been heads-down squashing over 60 bugs while focusing on high-touch first experiences like registration, login, and account

Read More »

Request a Demonstration