Release Notes
July 2021 Release Notes
We’ve spent all of July trying to squash as many bugs as possible while also adding simple enhancements to make the system easier to use.
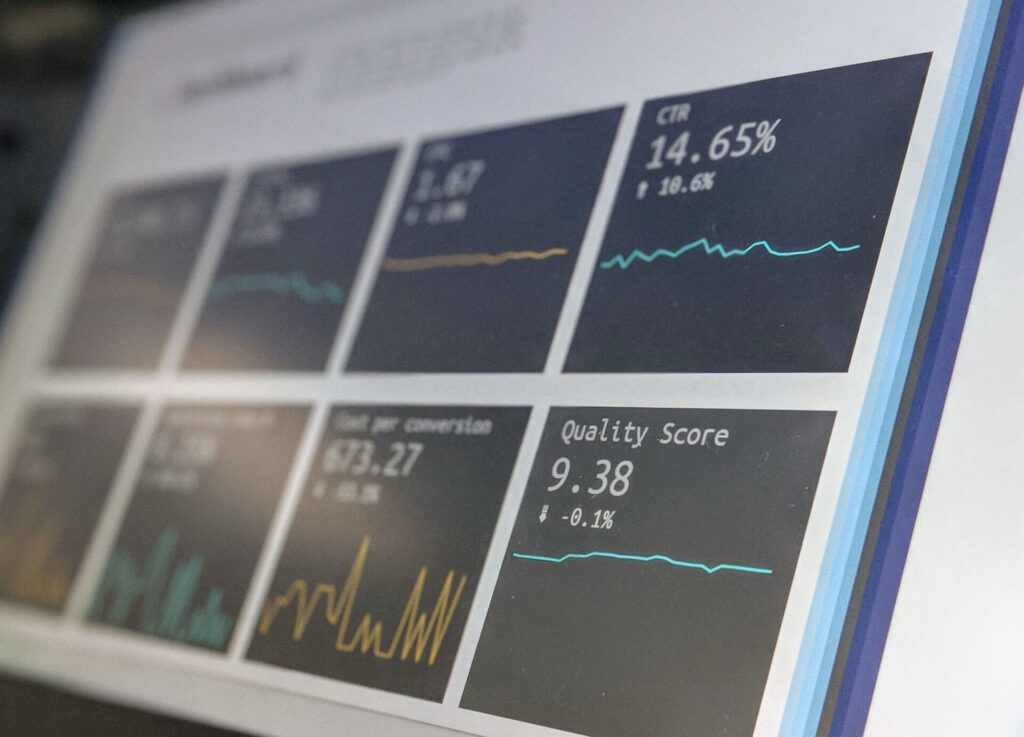
Home » Ten New Graphical Dashboard Widgets
You can now see graphs regarding orders and revenue by product type, by country, and by language. These are just the start of an even more advanced and powerful dashboard experience.
We’ve spent all of July trying to squash as many bugs as possible while also adding simple enhancements to make the system easier to use.
Peter Johnson of TRYTN was recently featured on The Digital Tourism Show to talk about reporting and why it’s important to tour operators. This was
We’ve been hard at work making the system more responsive and resilient. We’ve added another data center in the Eastern United States, updated how we