Ten New Graphical Dashboard Widgets

Ten New Graphical Dashboard Widgets

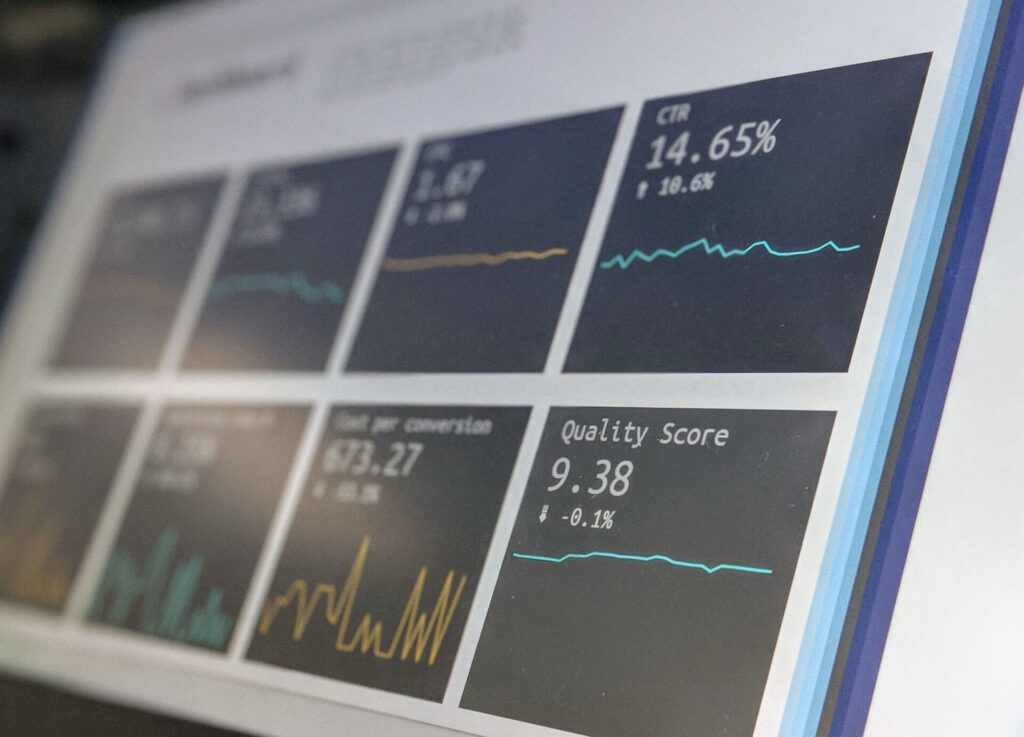
We recently added another new set of dashboard widgets to help tour and activity operators learn about how their operation is performing and be able to make decisions. This collection of ten new widgets are the first widgets available that utilize pie and bar charts to graphically display data.

You can now see graphs regarding orders and revenue by product type, by country, and by language. These are just the start of an even more advanced and powerful dashboard experience.

a woman sitting at a table using a laptop computer
Blog
Virginia

Seven Ideas for Slow Season

It’s hard to avoid having an “off-season” in any business. This is especially true in the tourism industry. By its very nature, the travel industry

Read More »

Request a Demonstration